Drawing the Map
Render the map on screen using nested loops, with blue block characters for walls.
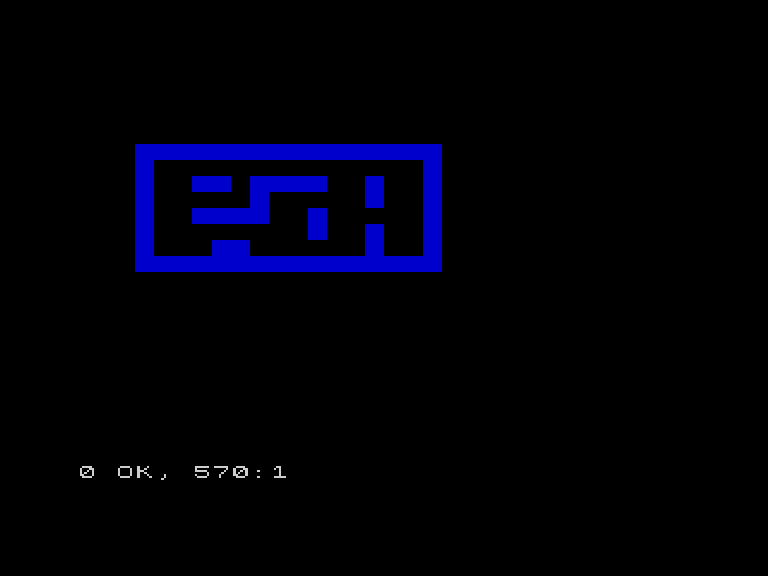
The map data is loaded — now draw it. Walls become solid blue blocks. Floors stay black. The building appears on screen, drawn from data.
The Program
10 BORDER 0: PAPER 0: INK 7: CLS
20 DIM m$(8, 16)
30 FOR i = 1 TO 8
40 READ m$(i)
50 NEXT i
60 REM draw map
70 FOR r = 1 TO 8
80 FOR c = 1 TO 16
90 IF m$(r)(c TO c) = "#" THEN PRINT AT r + 2, c + 2; INK 1; CHR$ 143
100 NEXT c
110 NEXT r
500 DATA "################"
510 DATA "#              #"
520 DATA "#  ## ####  #  #"
530 DATA "#     #     #  #"
540 DATA "#  ####  #     #"
550 DATA "#        #  #  #"
560 DATA "#   ##      #  #"
570 DATA "################"
How It Works
Lines 30-50 load the map data into m$(), exactly as before.
Line 60 calls the drawing subroutine with GO SUB 500.
Lines 500-560 draw the map. The outer loop (y) steps through rows 1 to 8. The inner loop (x) steps through columns 1 to 16. For each cell, it checks if the character is #. If so, it prints CHR$ 143 — the solid block character — in blue INK 1.
The offset y + 2, x + 2 shifts the map down and right by 2 positions. This leaves room at the top for the HUD (score, lives, instructions) and centres the map horizontally.
CHR$ 143: The Solid Block
The Spectrum has a set of block graphics characters from CHR$ 128 to CHR$ 143. CHR$ 143 is the fully filled block — every pixel lit. Combined with INK 1 (blue), it creates solid blue walls that look like brickwork on the black background.
Drawing from Data vs Hardcoding
Compare this to placing every wall with its own PRINT AT line. The data-driven approach means:
- One drawing routine handles any map layout
- Changing the map means editing DATA, not rewriting PRINT AT statements
- Multiple floors can use the same drawing code with different data
This is the pattern for every map-based game: data describes the world, code renders it.
Try This
Different wall character. Replace CHR$ 143 with CHR$ 130 or CHR$ 136 for a half-block wall. Some look like brick patterns.
Two colours. Add a second character to the map data (like = for doors) and draw it in a different colour.