The Bell in Bars
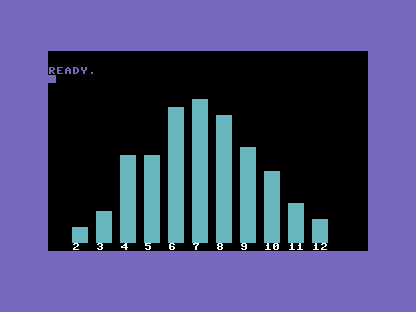
A column of figures isn't a picture. Walk the array and POKE each count as a bar of solid blocks straight to the screen — scaled to fit, on black, labelled beneath. The bell you read in numbers becomes a bell you can see.
The numbers tell the story, but a row of figures isn't a picture. The whole promise of Tally is to see the bell — and you already know how to draw on the C64 by hand. In Skyline you POKEd blocks into screen memory to build towers. Here you do the same, but the height of each column comes from the data: one bar per total, as tall as its count.
10 PRINT CHR$(147)
20 POKE 53281,0
30 DIM T(12)
40 FOR I=1 TO 1000
50 D=INT(RND(1)*6)+1+INT(RND(1)*6)+1
60 T(D)=T(D)+1
70 NEXT I
80 MX=0
90 FOR F=2 TO 12:IF T(F)>MX THEN MX=T(F)
100 NEXT F
110 FOR F=2 TO 12
120 H=INT(T(F)*18/MX)
130 C=(F-2)*3+3
140 FOR Y=0 TO H-1
150 POKE 1024+(23-Y)*40+C,160:POKE 55296+(23-Y)*40+C,3
160 POKE 1024+(23-Y)*40+C+1,160:POKE 55296+(23-Y)*40+C+1,3
170 NEXT Y
180 NEXT F
190 FOR F=2 TO 12
200 C=(F-2)*3+3
210 IF F<10 THEN POKE 1024+24*40+C,F+48:POKE 55296+24*40+C,1:GOTO 240
220 POKE 1024+24*40+C,49:POKE 55296+24*40+C,1
230 POKE 1024+24*40+C+1,(F-10)+48:POKE 55296+24*40+C+1,1
240 NEXT F
There's more here than usual, so take it in pieces. Line 20 sets the background black (POKE 53281,0) so
the bars stand out. Lines 80–100 find MX, the largest count, so the chart can be scaled:
line 120, H = INT(T(F)*18/MX), turns each count into a height where the biggest bar fills 18
rows and the rest fall in proportion — so the picture fits the screen whatever the numbers are.
The drawing is lines 110–180. For each total F, the column C is worked out from F so the
bars sit side by side, and the inner FOR Y loop POKEs solid blocks (screen code 160) up the
column into screen RAM from 1024, with cyan (colour 3) into colour RAM from 55296 — the same
two-write pattern as Skyline, a shape and its colour. Lines 190–240 POKE the totals 2–12 along
the bottom row as labels. The result is the bell, drawn by the machine from nothing but counted
dice.
Try this
- Recolour the curve. Change the
3in the POKEs to colour RAM to5(green) or7(yellow). The whole bell shifts hue at once. - Read the heights. The tallest bar is 7, scaled to fill the screen. Cover the labels and you can still name each total just from how tall its bar is — that's the data made visible.
What's next
The chart is locked to a thousand rolls. In Unit 6 you hand the run count to the player with
INPUT — roll 10 for a ragged guess, 1000 for a clean bell, and watch the shape sharpen.