The Bar Chart
One row of solid blocks per face turns six numbers into a shape you read at a glance — and a colour each makes the distribution unmistakable. Dice Roller, complete.
The dashboard gives you six numbers. To compare them you still have to read and subtract in
your head. A bar chart does that work for you: length is something the eye compares instantly.
You already have every tool — CHR$ 143, the solid block from Oracle Stone; a FOR loop to
repeat it; and INK for colour.
10 BORDER 0: PAPER 0: INK 7: CLS
20 RANDOMIZE
30 LET a$ = "*** DICE ROLLER ***": LET y = 3: GO SUB 9000
40 PRINT
50 INPUT "How many rolls? "; n
60 CLS
70 LET t1 = 0: LET t2 = 0: LET t3 = 0
80 LET t4 = 0: LET t5 = 0: LET t6 = 0
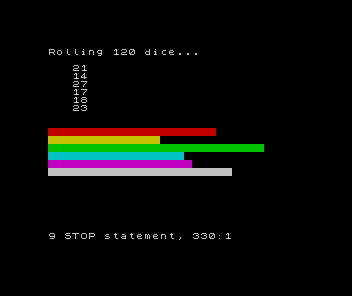
90 PRINT "Rolling "; n; " dice..."
100 PRINT
110 FOR i = 1 TO n
120 LET d = INT (RND * 6) + 1
130 IF d = 1 THEN LET t1 = t1 + 1
140 IF d = 2 THEN LET t2 = t2 + 1
150 IF d = 3 THEN LET t3 = t3 + 1
160 IF d = 4 THEN LET t4 = t4 + 1
170 IF d = 5 THEN LET t5 = t5 + 1
180 IF d = 6 THEN LET t6 = t6 + 1
190 PRINT AT 2, 3; t1; " "
200 PRINT AT 3, 3; t2; " "
210 PRINT AT 4, 3; t3; " "
220 PRINT AT 5, 3; t4; " "
230 PRINT AT 6, 3; t5; " "
240 PRINT AT 7, 3; t6; " "
250 NEXT i
260 PRINT AT 9, 0
270 INK 2: FOR j = 1 TO t1: PRINT CHR$ 143;: NEXT j: PRINT
280 INK 6: FOR j = 1 TO t2: PRINT CHR$ 143;: NEXT j: PRINT
290 INK 4: FOR j = 1 TO t3: PRINT CHR$ 143;: NEXT j: PRINT
300 INK 5: FOR j = 1 TO t4: PRINT CHR$ 143;: NEXT j: PRINT
310 INK 3: FOR j = 1 TO t5: PRINT CHR$ 143;: NEXT j: PRINT
320 INK 7: FOR j = 1 TO t6: PRINT CHR$ 143;: NEXT j: PRINT
330 STOP
9000 PRINT AT y, (32 - LEN a$) / 2; BRIGHT 1; a$
9010 RETURN
Numbers into shape
Line 260 moves the cursor below the dashboard with PRINT AT 9, 0. Then lines 270–320 draw
one bar per face. Each is a tiny FOR loop: FOR j = 1 TO t1: PRINT CHR$ 143;: NEXT j prints
t1 solid blocks in an unbroken row, then PRINT drops to the next line for the following
face. A face that came up 27 times gets a bar 27 blocks long — the count becomes a length.
This is data visualisation: the same information as the dashboard, in a form the eye reads without counting. Six bars of nearly equal length say "fair die" far faster than six numbers do.
A colour each
Each bar line starts with an INK: red, yellow, green, cyan, magenta, white. Without colour
the six rows blur into one block; with it, every face is distinct and the longest bar jumps
out. Colour here is not decoration — it is what makes the chart legible.
Make it yours
Run it with 10 rolls, then 100, then 10000. Watch the bars start jagged and settle level —
the more dice, the flatter the chart. Change the die: INT (RND * 12) + 1 for a twelve-sider
(you would need six more counters and bars). Change the colours. Add a label under each bar.
What you built
Dice Roller began as one die in one line and grew into a simulation: six counters that
accumulate, a dashboard that updates in place, an experiment the player sizes, and a colour
bar chart that makes the result obvious. Not one command in it was new — RND, FOR,
IF, PRINT AT, INPUT, GO SUB, CHR$ 143, INK all came from earlier. What was new is
the combination: turning a heap of random numbers into a picture that tells you something
true. That is what a program is for.
Next: Bright Spark — a memory game where the player must repeat a sequence that grows one step longer each round.