Dice Roller
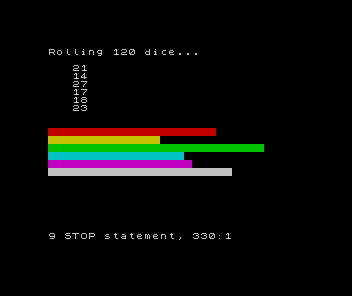
Roll thousands of dice and watch a flat, even distribution rise out of pure randomness — a live dashboard and a colour bar chart built from tools you already have.
Dice Roller is not a game — it is a simulation. Roll dice, tally the faces, and watch the six totals climb together toward an even spread. One roll is pure chance; a thousand rolls have a shape. The whole point is seeing that order rise out of the chaos.
There is almost no new syntax here, and that is the point. You already roll dice with
INT (RND * 6) + 1, count with FOR/NEXT, place text with PRINT AT, and draw solid bars
with CHR$ 143 — all from Meet BASIC and Oracle
Stone. Dice Roller is where those pieces combine into something none of them is alone: a tool
that turns a pile of random numbers into a picture you can read at a glance.
What you will build:
- A tally — six counters that accumulate as the dice land (the core idea)
- A live dashboard —
PRINT AToverwriting the totals in place, so you watch them climb - An experiment you control —
INPUTsets the number of rolls, from ten to ten thousand - A colour bar chart —
CHR$ 143blocks, one row per face, turning numbers into shape - The design concept: accumulation — a clear pattern emerging from random noise
5 units. About 3–5 hours. This builds on Meet BASIC — start there if you haven't.
Unit roadmap
Roll and count
Roll a fistful of dice, then tally every face
Watch it live
A live dashboard, and an experiment you control
See the shape
Turn the tallies into a colour bar chart